Site Reliability Engineering (SRE) transforms how organizations build and maintain reliable systems. As software becomes increasingly complex, the need for robust, scalable, and resilient systems grows. SRE principles provide a framework for achieving these goals. This article explores 10 essential SRE principles that form the foundation of reliable systems. You'll learn how to implement these practices to improve system performance, reduce downtime, and enhance user satisfaction.
Quick Guide: 10 Essential SRE Principles
1. Embracing Risk: A Fundamental SRE Principle
In SRE, risk isn't something to avoid—it's something to understand and manage. Embracing risk means making informed decisions about what to prioritize for reliability and accepting that perfect uptime is an unrealistic goal.
2. Setting and Measuring Service Level Objectives (SLOs)
SLOs are the heart of SRE’s approach to reliability. By clearly defining what success looks like, we can make better decisions on where to focus resources and ensure we meet user expectations consistently.
3. Eliminating Toil Through Automation
Toil is any repetitive, manual work that doesn’t add value. SREs focus on eliminating toil by automating tasks, freeing up time for innovation and ensuring teams work on things that truly matter.
4. Implementing Effective Monitoring Systems
A good monitoring system is the backbone of proactive reliability. With the right metrics and alerts, SRE teams can catch issues early, minimize downtime, and ensure the system performs as expected.
5. Simplicity as a Core SRE Principle
The simpler the system, the easier it is to manage and scale. In SRE, we prioritize simplicity to reduce complexity, making systems more predictable and easier to maintain over time.
6. Embracing Failure: Learning from Incidents
Failures aren’t just setbacks—they’re valuable learning opportunities. In SRE, we embrace failure, dissect incidents, and use those insights to improve system design and resilience.
7. Continuous Improvement Through Release Engineering
Release engineering is about making deployment processes smoother, faster, and more reliable. SRE encourages continuous improvement here to minimize risk and ensure new features are delivered seamlessly.
8. Capacity Planning and Demand Forecasting
Predicting future demand and ensuring sufficient capacity is critical. SRE teams use data-driven insights to plan for growth, so systems can handle spikes without unexpected outages.
9. Cultivating a Culture of Shared Responsibility
Reliability is everyone’s job. In SRE, responsibility is shared across teams—developers, operations, and business leaders alike—so that all stakeholders are invested in maintaining high-quality, reliable services.
10. Leveraging Observability for System Reliability
Observability goes beyond monitoring—it’s about gaining deep insights into how your system behaves in real time. SREs use observability tools to quickly diagnose issues and maintain system health before they impact users.
What is Site Reliability Engineering (SRE)?
Site Reliability Engineering is a discipline that applies software engineering principles to IT operations. Google pioneered SRE to create scalable and highly reliable software systems. SRE combines aspects of software engineering with systems engineering to solve operational challenges.
Site Reliability Engineering (SRE): Key Aspects
- Focus on automation: SRE reduces human intervention by automating repetitive tasks, improving efficiency and reliability. For example, alerts are automatically triggered when an SLO is violated, along with playbooks and tickets for the incident response team, ensuring quick and accurate resolution.
- Data-driven decision making: SRE uses real-time metrics like latency and error rates to optimize resource allocation and maintain reliability. For instance, frequent transient errors might trigger automated retries, while resource allocation and error budgets are adjusted based on historical data and forecasts.
- Proactive approach: SRE identifies and addresses potential issues before they disrupt the system using practices like chaos engineering and load testing. For example, simulating failures helps teams understand system impacts, refine recovery processes, and prepare for actual incidents.
- Balance between reliability and innovation: SRE balances system stability with feature development using error budgets. If the error budget is close to being exceeded, new feature deployments are paused for reliability work, while a healthy error budget allows for more feature releases. We will learn more about error budgets later in this article.
SRE v/s traditional IT operations

Let’s look at a tabular comparison for the same:
| Aspect | Site Reliability Engineering (SRE) | Traditional IT Operations |
|---|---|---|
| Primary Goal | Focuses on reliability, scalability, and automation | Emphasizes availability and incident resolution |
| Responsibility | Shared accountability with development teams (DevOps-oriented) | Dedicated operations team, often separate from developers |
| Key Metric | Service Level Objectives (SLOs) and Error Budgets | Service Level Agreements (SLAs) |
| Approach to Incidents | Blameless postmortems to learn and improve | Root cause analysis to prevent recurrence |
| Automation | High priority on automation and self-healing systems | Often manual processes and reliance on monitoring tools |
| Tooling | Uses advanced observability tools, automation, and CI/CD | Traditional monitoring tools, incident management systems |
Why SRE Principles Matter for System Reliability
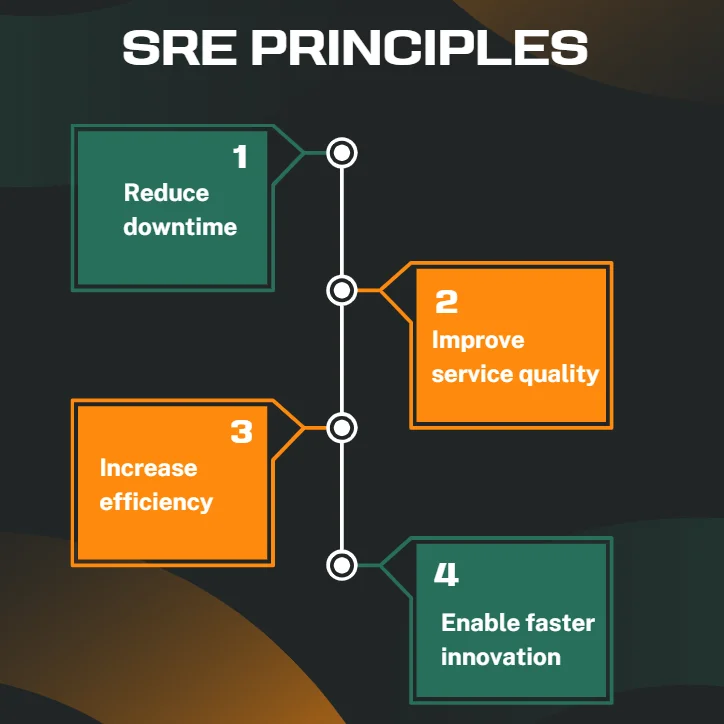
SRE principles significantly impact system performance and user satisfaction. By implementing these principles, organizations can:
- Reduce downtime: SRE practices, such as proactive monitoring and alerting, help detect and mitigate issues before they cause major outages, ensuring higher system availability.
- Improve service quality: Continuous monitoring, automated testing, and fast incident resolution lead to a smoother and more reliable user experience, fostering customer trust.
- Increase efficiency: Automation, standardized processes, and eliminating manual tasks reduce human error, enabling teams to focus on high-value work while improving system reliability.
- Enable faster innovation: By maintaining a balance between system reliability and new feature development, SRE empowers teams to release updates quickly while minimizing risk to system stability.
SRE principles align with business objectives by:
- Enhancing customer satisfaction: Consistently reliable services result in better customer experiences and retention. By automating the Software Development Life Cycle (SDLC), SRE helps reduce bugs, enabling teams to focus on innovation and faster feature delivery.
- Reducing operational costs: Proactive monitoring, automation, and efficient incident response minimize downtime and reduce the need for manual intervention, cutting operational expenses.
- Supporting scalability: With SRE’s organizations can scale their systems to meet growing demands without sacrificing service quality. It enables scalability by providing automation, proactive monitoring, reliable infrastructure, and efficient use of resources
Initial investments in SRE tools and training may seem high, but they pay off in the long run through lower maintenance costs, fewer outages, and faster recovery times, resulting in substantial savings over time.
1. Embracing Risk: A Fundamental SRE Principle
You might think aiming for 100% reliable services is ideal, but past a certain point, extreme reliability does more harm than good. Pushing for perfection slows down feature development, delays product delivery, and drives up costs, limiting what teams can offer. Interestingly, users often can’t distinguish between high and near-perfect reliability because other factors dominate their experience. For instance, a streaming platform that works flawlessly won’t matter much if the user’s internet connection buffers every few minutes.
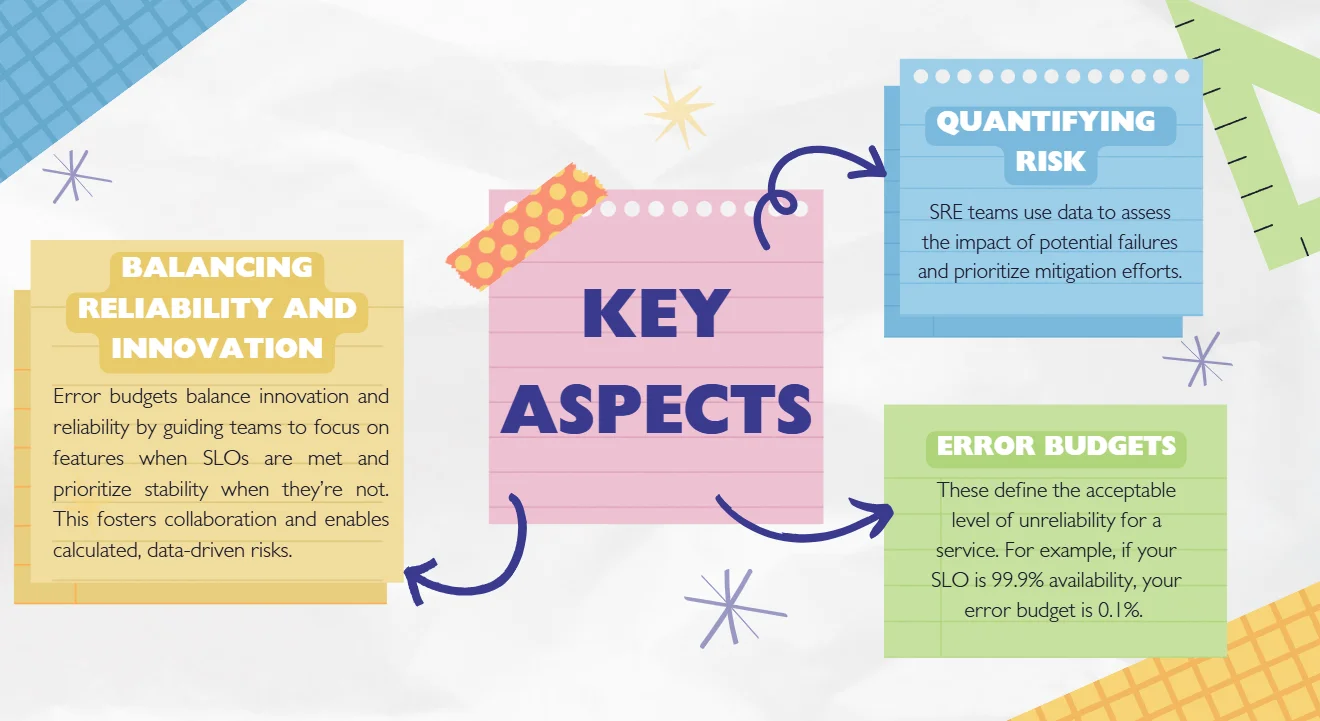
That’s why Site Reliability Engineering focuses on balancing availability with rapid innovation and efficient operations, optimizing overall user satisfaction across features, performance, and service.
In SRE, managing service reliability is all about managing risk. Risk is viewed as a spectrum, and the focus is split between improving system reliability and determining the right level of tolerance for the services we provide.
Error budgets
The error budget is a tool that SRE teams use to automatically reconcile a company's service reliability with its pace of software development and innovation. Error budgets establish a level of error risk that aligns with the service level agreements.
An uptime target of 99.999%, known as the “five-nines availability,” is a common SLA threshold. That means the monthly error budget—the total amount of downtime allowable without contractual consequence for a specific month—is about 4 minutes and 23 seconds. If a development team wants to implement new features or improvements to a system, the system must not exceed the error budget.
Formula for Error Budgets
The error budget is derived from the Service Level Objective (SLO) and represents the difference between perfect availability and target availability. The formula for calculating an error budget is pretty simple:
Error Budget = (1 - SLO Target) * Total Time
Let’s take an example to understand it better,
If the SLO target is 99.9% uptime per month (30 days), the error budget calculation would be:
Error Budget = (1 - 0.999) * 30 days
             = 0.001 * 30 days
             = 0.03 days
             = 43.2 minutes
This means the service can afford up to 43.2 minutes of downtime in a month while still meeting its SLO
In essence, SLIs provide the data, SLOs set the targets based on that data, and error budgets allow teams to balance reliability with the need for rapid innovation.
To effectively manage risk:
- Regularly review and update error budgets based on business needs and user expectations.
- Implement robust monitoring to track error budget consumption.
- Encourage a culture where teams feel comfortable discussing and learning from failures.
2. Setting and Measuring Service Level Objectives (SLOs)
To manage a service effectively, it’s essential to understand the key behaviors that matter and how to measure them. This involves defining and delivering a specific level of service to users, whether through an internal API or a public product.
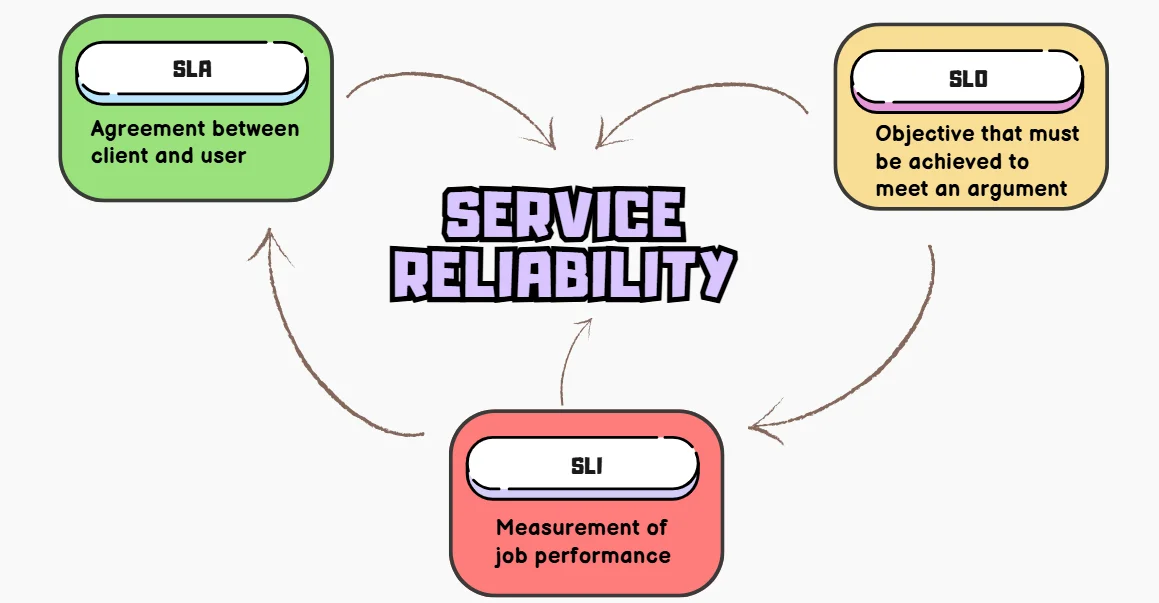
Service Level Objectives (SLOs) are a critical component of SRE practices. They are a tool to help determine what engineering work to prioritize. These metrics outline what matters, the desired values, and the response if expectations aren’t met. Properly chosen metrics guide corrective actions during issues and assure SRE teams of a service’s health.
| Term | Definition | Example |
|---|---|---|
| SLI (Service Level Indicator) | A quantitative measure of service performance or reliability. | Request latency, error rate, uptime percentage. |
| SLO (Service Level Objective) | A target value or range for an SLI that defines acceptable performance. | 99.9% of requests should have latency < 200ms. |
| SLA (Service Level Agreement) | A formal agreement between provider and customer specifying service expectations. | Uptime of 99.5% per month, with penalties for breaches. |
Establish Effective SLOs:
- Identify key user journeys and critical system components.
- Choose relevant SLIs that reflect user experience.
- Set realistic, achievable targets based on historical data and business requirements.
- Regularly review and adjust SLOs as system capabilities and user expectations evolve.
3. Eliminating Toil Through Automation
Toil is the kind of work tied to running a production service that tends to be manual, repetitive, automatable, tactical, devoid of enduring value, and that scales linearly as a service grows. Not every task deemed toil has all these attributes. So then, how do we identify it?
The following descriptions should provide some insight:
| Title | Description |
|---|---|
| Manual | Automation should replace manual tasks, not just speed them up. For example, running a script to automate a series of processes might save time compared to doing each step manually. However, if a person still needs to actively execute the script, the time spent doing so counts as toil, since the goal is to eliminate human involvement in repetitive tasks |
| Repetitive | If you're tackling a task for the first time—or even the second time—this isn't considered toil. Toil refers to repetitive work you do repeatedly. If you're addressing a new problem or coming up with a unique solution, that work isn't toil either. |
| Automatable | If a machine could perform the task as effectively as a human, or if the task could be eliminated through better design, then it's considered toil. |
| Tactical | Toil is reactive and often driven by interruptions, rather than being proactive or aligned with strategy. For example, responding to pager alerts is toil—urgent and disruptive. While it’s hard to eliminate entirely, the goal is to minimize its impact and focus on more strategic work |
| No enduring value | If completing a task leaves your service unchanged, it's likely toil. However, if the task results in a lasting improvement to your service, it probably wasn't toil, even if it involved some tedious work, like cleaning up legacy code and configurations. |
| O(n) with service growth | If the effort required for a task increases in direct proportion to the size of the service, traffic, or user base, it’s likely toil. An optimally designed and managed service should be able to scale by at least an order of magnitude with minimal additional work, aside from one-time efforts to add resources. |
Automating Repetitive Tasks: Strategies
- Infrastructure as Code (IaC): Use tools like Terraform or CloudFormation to automate infrastructure provisioning. This eliminates manual setup, reduces errors, and ensures consistency across environments. It also enables version control for infrastructure, making rollbacks and updates seamless.
- Configuration Management: Implement tools like Ansible or Puppet to automate system configuration. These tools help maintain desired states for servers and applications, making updates and scaling more efficient. They also reduce human intervention, minimizing risks of misconfigurations.
- Continuous Integration/Continuous Deployment (CI/CD): Automate testing and deployment processes to accelerate software delivery. By integrating frequent code changes and running automated tests, CI/CD pipelines catch bugs early and ensure smooth deployments. This drastically reduces manual intervention, improving reliability and developer productivity.
- Runbooks and Playbooks: Create automated scripts for common operational tasks, such as troubleshooting or system maintenance. These predefined workflows standardize responses to issues, reducing resolution times. Automation also empowers teams to handle repetitive tasks efficiently, freeing up time for strategic work.
Implementing Automation
- Start with high impact, frequently performed tasks: Focus on tasks that are repetitive, time-consuming, and prone to human error, such as provisioning servers or running health checks. Prioritizing these ensures maximum return on effort while freeing up valuable time for strategic initiatives.
- Ensure automated processes are well-documented and maintainable: Clearly document automation workflows, including steps, tools used, and troubleshooting procedures. This makes it easier for teams to understand, update, and maintain automation scripts, reducing technical debt over time.
- Continuously review and improve automation scripts: Regularly assess automation workflows for efficiency and relevance. As systems evolve, ensure scripts are updated to align with current requirements, leveraging new tools or methodologies to enhance performance.
Case study: A large e-commerce company reduced their deployment time from hours to minutes by automating their release process, resulting in faster feature delivery and fewer deployment-related issues.
4. Implementing Effective Monitoring Systems
Monitoring and alerting allow a system to notify us when something is broken or when something is about to break. When the system can’t self-correct, a human needs to investigate the alert, assess whether there’s an actual issue, mitigate the problem, and identify its root cause.
Four Golden Signals
If you measure all four golden signals and page a human when one signal is problematic (or, in the case of saturation, nearly problematic), your service will be at least decently covered by monitoring.
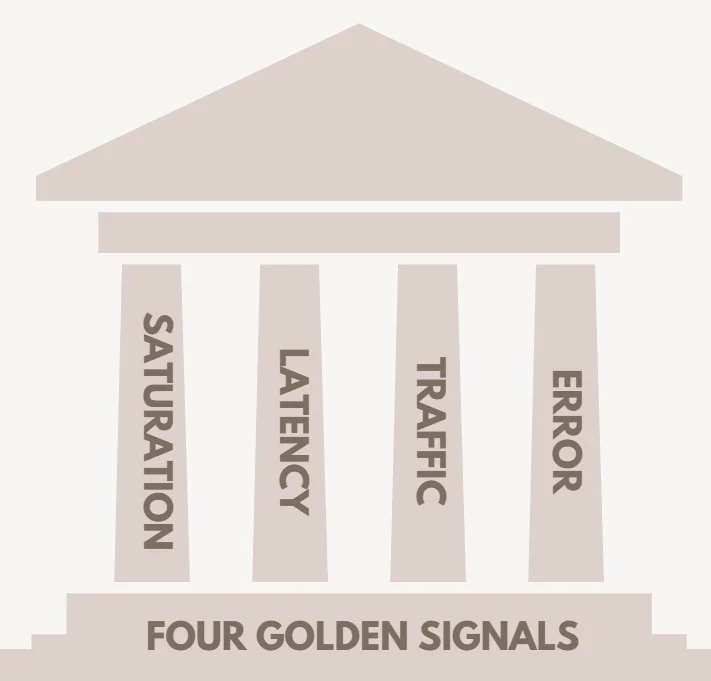
- Latency: Measures the time to process a request. It's important to separate successful and failed request latencies. For instance, an HTTP 500 error might be served quickly but still counts as a failure, skewing latency calculations. Tracking error latency specifically is crucial since slow errors are worse than fast ones.
- Traffic: Reflects system demand, measured in a high-level metric specific to your service. For a web service, it might be HTTP requests per second, while for a streaming platform, it could be networking I/O or concurrent sessions. Tailor this metric to your system's nature, like transactions per second for storage systems.
- Errors: The rate of failed requests, whether explicit (like HTTP 500s), implicit (e.g., wrong content served), or policy-based (e.g., requests exceeding a committed response time). While load balancers can track failures like HTTP 500s, deeper issues like incorrect content often require end-to-end tests or secondary protocols.
- Saturation: Indicates how "full" your system is, focusing on its most constrained resources (e.g., memory or I/O). Many systems degrade before reaching full utilization, so setting a target is key. Metrics like CPU usage or network bandwidth can signal limits, with latency spikes often being an early warning. Additionally, predicting saturation, such as disk space running out, helps avoid failures.
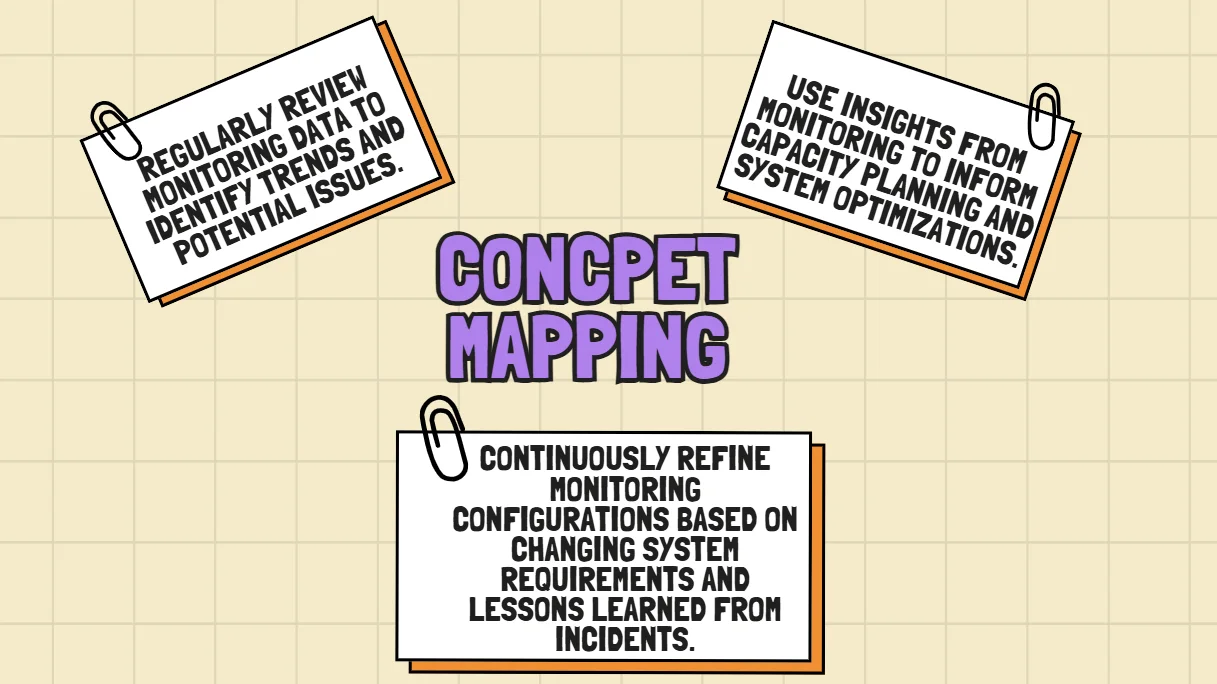
Key Components of Comprehensive Monitoring Strategy
Metrics Collection
Metrics are the backbone of any monitoring system. They provide quantitative data on how the system is performing, such as CPU usage, memory utilization, request latency, and user interactions. Collect metrics at various levels: application, infrastructure, and end-user. High-frequency metrics can help detect anomalies faster, while aggregated metrics give a broader performance overview. Tools like Prometheus or OpenTelemetry can aid in collecting and exporting these metrics effectively.
Log Aggregation
Logs capture detailed records of events within your system, including errors, transactions, and user actions. Aggregating logs into a centralized platform allows for easier searching, filtering, and correlation across components. This is critical for troubleshooting and root cause analysis. Tools like Elasticsearch or Loki can help consolidate logs, while structured logging ensures consistency and readability.
Alerting
Alerting transforms monitoring data into actionable insights. By setting thresholds or conditions tied to service-level objectives (SLOs), you can proactively address potential issues before they impact users. For example, if the latency exceeds a set value, or the error rate breaches acceptable limits, alerts notify the appropriate teams. Tools like Alertmanager or PagerDuty integrate seamlessly with monitoring systems to automate alert dispatching.
Dashboards
Dashboards provide a real-time visual representation of system health and key metrics. They simplify complex datasets, enabling teams to quickly spot trends or anomalies. Use dashboards to display metrics like latency, error rates, and resource usage, tailored to different audiences such as developers, SREs, or management. Tools like Grafana allow for customizable and interactive dashboards.
Implement Effective Monitoring
Select Appropriate Metrics
Start by identifying metrics that directly reflect user experience and system reliability. For example, prioritize latency, error rates, and resource utilization. Avoid drowning in data by focusing on metrics aligned with your SLOs. Use techniques like the Four Golden Signals that we just discussed earlier in this section.
Implement a Robust Monitoring Stack
A well-integrated stack is essential for observability. Use tools like Prometheus for collecting and storing metrics, Grafana for visualization, and SigNoz for end-to-end observability. Open-source tools combined with proprietary solutions can provide flexibility and depth, ensuring scalability as your system grows.
Set Up Meaningful Alerts
Alerts should be actionable and tied to SLO violations or critical thresholds, ensuring they aren’t ignored due to alert fatigue. Categorize alerts by severity (e.g., warnings vs. critical) and ensure clear escalation paths. Use runbooks to guide teams on responding to specific alerts, minimizing downtime and confusion.
Establish On-Call Rotations
Timely responses to alerts are vital. Rotate on-call responsibilities among team members to distribute the workload fairly and avoid burnout. Use tools like Opsgenie or PagerDuty to manage schedules and escalation policies. Incorporate post-incident reviews to continuously refine the on-call process and improve response times.
5. Simplicity as a Core SRE Principle
Simplicity, a core SRE principle, advocates for building systems that are easy to understand, operate, and troubleshoot. Simple releases outperform complex ones as they make it easier to measure the impact of individual changes. Releasing 100 unrelated changes simultaneously complicates performance analysis and troubleshooting, requiring significant effort or extra instrumentation. By releasing smaller batches, teams can progress confidently, isolating and understanding each change's effect. This approach resembles gradient descent in machine learning, where small, incremental steps lead to optimized outcomes by evaluating improvements or degradations with each adjustment.
Techniques for Reducing Complexity
- Modular Design: Break systems into smaller, self-contained components with clear interfaces. This allows individual parts to be updated or fixed without impacting the entire system, promoting agility and stability. Proper modularity also includes versioned APIs, enabling safe transitions without disrupting dependencies and maintaining backward compatibility, like Google's protocol buffers.
- Minimal APIs: Design APIs with only essential methods and arguments to make them easier to understand and use. A focused API lets developers concentrate on solving core problems effectively without being overwhelmed by unnecessary complexity. Minimal APIs often signal a well-defined problem and a deliberate choice to prioritize quality over quantity.
- Standardization: Adopt consistent tools, technologies, and patterns across the system to reduce complexity and ease collaboration. By standardizing configurations and processes, teams can streamline workflows, reduce cognitive load, and ensure predictable behavior across all environments.
- Clear Documentation: Provide concise, accurate, and regularly updated documentation to guide developers and operators. Good documentation eliminates guesswork, simplifies onboarding, and ensures that systems remain accessible and understandable as they evolve.
- Regular Refactoring: Periodically review code and infrastructure to identify unnecessary complexity and simplify where possible. Continuous refactoring prevents technical debt from accumulating and ensures the system remains scalable, efficient, and easy to maintain.
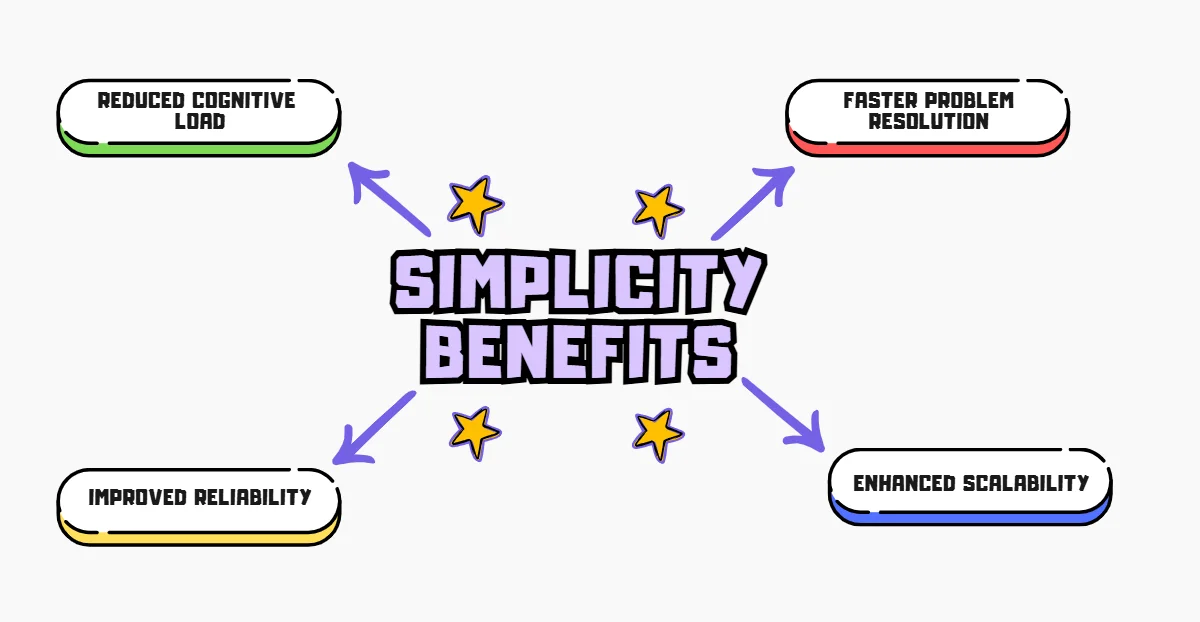
Balance Simplicity with Feature Requirements:
- Prioritize Essential Features: Focus on features that directly contribute to core business objectives, avoiding unnecessary complexity. By aligning development with business goals, you ensure the system remains lean, efficient, and aligned with customer needs.
- Use Feature Flags: Implement feature flags to manage complexity and introduce new functionality gradually. This allows for safe experimentation, easy rollbacks, and the ability to fine-tune user experiences without overwhelming the system.
- Regularly Review and Deprecate Features: Periodically evaluate features to identify and phase out those that are no longer necessary or used. By removing obsolete features, you reduce system clutter, improve maintainability, and keep the focus on high-value functionalities.
Example: A tech company simplified their microservices architecture by consolidating related services and standardizing their communication protocols. This resulted in a 30% reduction in operational overhead and improved system reliability.
6. Embracing Failure: Learning from Incidents
Embracing failure is a crucial SRE principle that recognizes incidents as opportunities for learning and improvement. This approach focuses on conducting thorough postmortems to analyze incidents and prevent future occurrences.
Key Aspects of Embracing Failure
- Blameless Postmortems: Focus on identifying systemic issues rather than blaming individuals. This encourages open discussions and helps address the root causes of problems, leading to better solutions.
- Continuous Learning: Treat incidents as learning opportunities to improve processes and systems. Analyzing what went wrong helps teams adapt and grow stronger over time.
- Proactive Improvement: Implement changes based on postmortem findings to prevent future incidents. Proactive updates to processes and monitoring enhance system reliability and reduce the chance of recurrence.
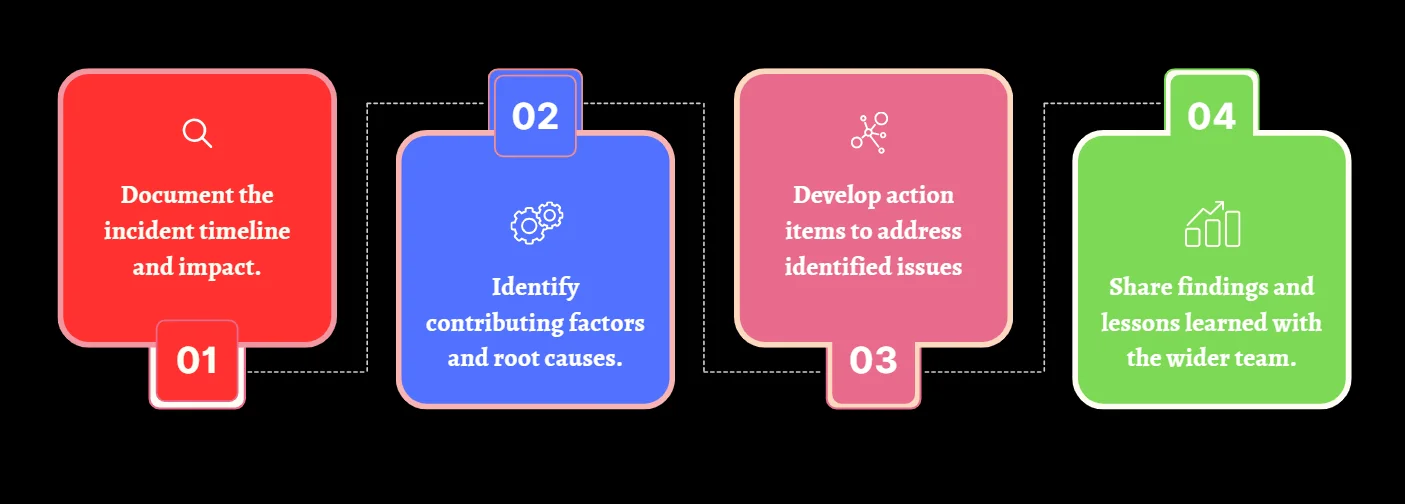
Implement a Systematic Approach to Incident Analysis
- Standardized Postmortem Template: Use a consistent format for postmortem reports to ensure thorough and clear analysis. This helps in capturing all critical details and makes it easier to identify recurring issues.
- Involve Relevant Stakeholders: Ensure all key team members and departments are part of the postmortem process. This allows for a comprehensive understanding of the incident and ensures all perspectives are considered.
- Set Clear Timelines: Establish deadlines for completing postmortems and implementing corrective actions. This ensures timely resolution and accountability, preventing delays in improvements.
- Review Past Incidents: Regularly analyze previous incidents to spot patterns or systemic problems. This helps in proactively addressing recurring issues and improving overall system stability.
By embracing failure and learning from incidents, organizations can continuously improve their systems' reliability and resilience.
7. Continuous Improvement Through Release Engineering
Release engineering is a critical aspect of SRE that focuses on the processes and tools used to deliver software updates reliably and efficiently.
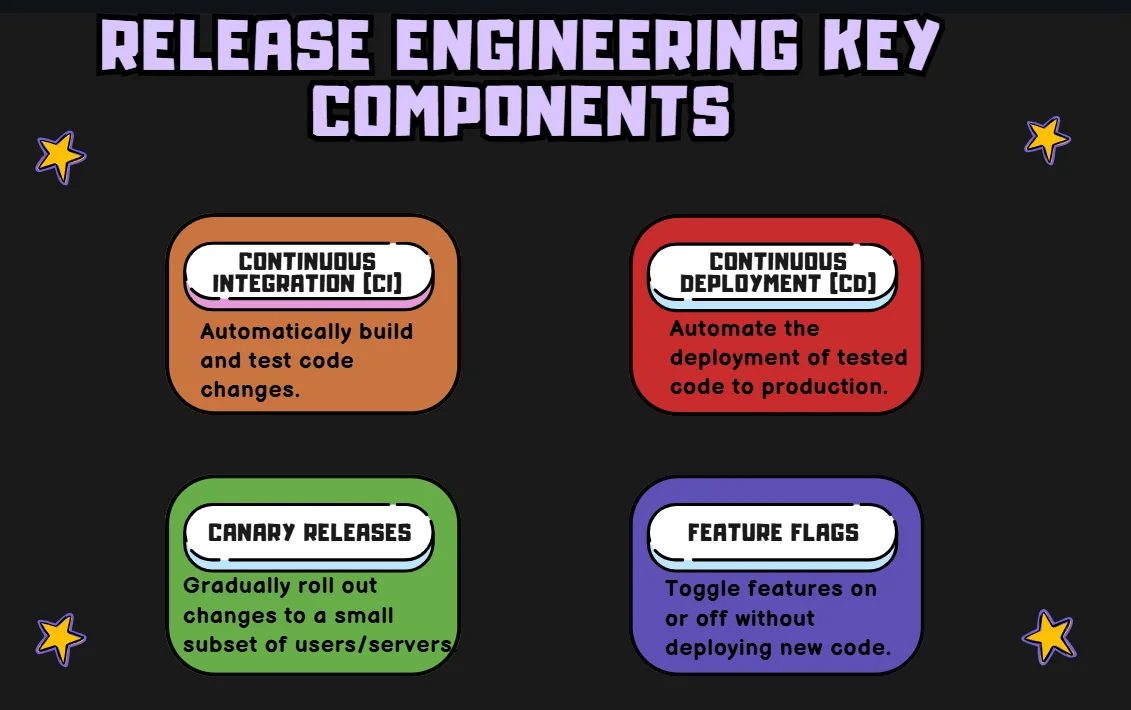
Implementing Robust Release Processes
- Standardize Pipelines: Implement uniform CI/CD pipelines using tools like Jenkins, GitLab CI, or GitHub Actions across all projects. This includes consistent build, test, and deployment steps that automatically trigger on code changes. This ensures that each environment (development, staging, production) is tested the same way, reducing human error and ensuring consistency across all deployments.
- Version Control for Configurations: Use Git or similar version control systems to manage not only application code but also infrastructure as code (IaC) and configuration files. Tools like Terraform, Ansible, or Kubernetes configuration files should be version-controlled to enable traceability and rollback in case of issues. This ensures consistency across environments and the ability to reproduce any infrastructure setup, reducing configuration drift.
- Automated Testing: Leverage unit, integration, and end-to-end testing within the CI/CD pipeline using tools like Jest, JUnit, and Selenium. Unit tests ensure individual components function as expected, integration tests verify interactions between components, and end-to-end tests ensure the system works as a whole. This multi-level approach catches regressions, integration issues, and UI bugs before reaching production.
- Rollback Mechanisms: Automate rollback strategies using tools like Helm for Kubernetes or GitLab’s Auto DevOps. Rollbacks can be triggered automatically in case of deployment failure, reverting to a stable release and reducing downtime. Containerized environments like Docker also facilitate rollbacks to previous container images, enabling fast recovery.
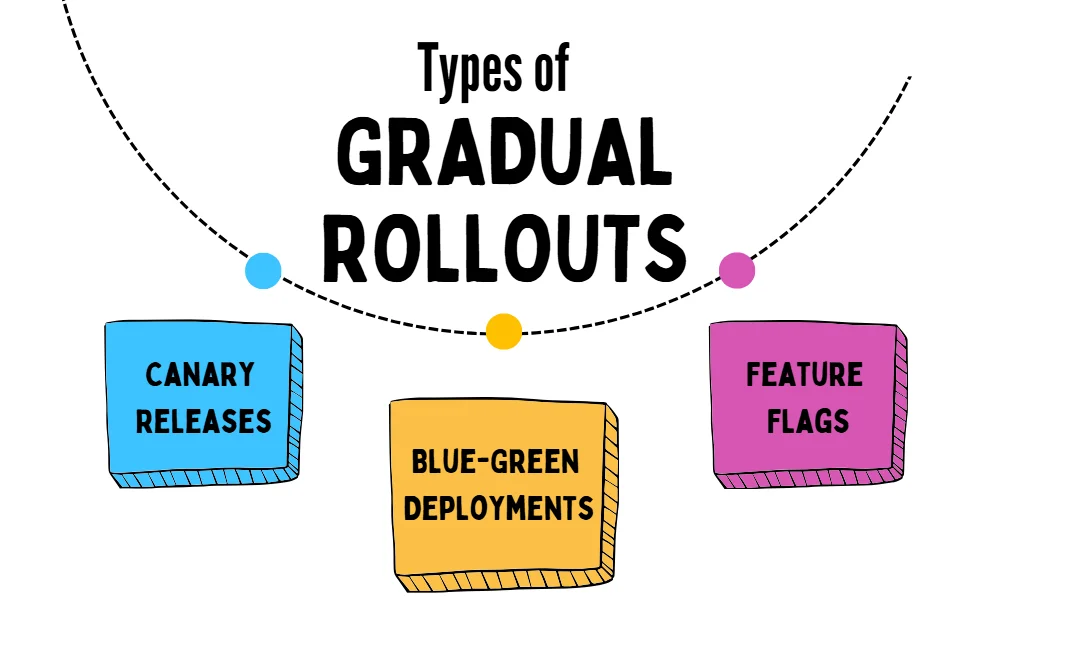
Strategies for Gradual Rollouts
| Strategy | Description |
|---|---|
| Canary Releases | Set up canary deployments with tools like Kubernetes’ rolling updates or services like AWS Elastic Beanstalk and Google Cloud Run. Start by releasing the update to a small group of users, monitor performance with tools like Prometheus or Datadog, and gradually increase traffic if all looks good. This reduces the risk of widespread issues. |
| Blue-Green Deployments | Use blue-green deployment with load balancers like AWS ELB or Nginx to direct traffic to the "green" environment (the updated version), while the "blue" environment runs the stable version. Once the green environment is validated, switch the load balancer to send all traffic there. This allows for zero-downtime updates and minimizes deployment risks. |
| Feature Flags | Manage feature releases with feature flagging tools like LaunchDarkly or Unleash. This lets you deploy code with features hidden or disabled, then gradually enable them for specific user groups or environments without needing to redeploy. Feature flags make it easier to test new features in production, control rollouts, and quickly disable any problematic features. |
Monitoring and Validating Releases
- Comprehensive Monitoring: Set up monitoring using tools like Prometheus, Grafana, or Datadog to collect metrics on key performance indicators (KPIs) such as system load, error rates, and response times. Ensure that alerts are triggered for any anomalies. Application performance management (APM) tools like New Relic or Datadog APM provide deeper insights into code-level performance and service dependencies, helping detect issues early.
- Automated Alerts: Use monitoring tools to configure automated alerts for critical metrics like latency, error rates, or resource utilization. Integrate alerting with platforms like PagerDuty or Opsgenie for on-call escalation, ensuring that the appropriate teams are notified in case of issues. Alerts should include detailed context about the issue, such as the impacted services, affected users, and potential causes.
- Post-Deployment Reviews: After deployment, conduct regular post-deployment reviews using a combination of monitoring tools and postmortem analysis. Tools like Splunk or ELK stack (Elasticsearch, Logstash, and Kibana) can be used for centralized log aggregation to correlate logs from different services and analyze the root cause of any issues. This analysis helps to identify patterns, measure the impact of changes, and continuously improve the release process.
By focusing on continuous improvement in release engineering, organizations can increase the speed and reliability of their software delivery process.
8. Capacity Planning and Demand Forecasting
Effective capacity planning and demand forecasting are essential for maintaining reliable systems as they grow and evolve.
Accurate Capacity Planning: Techniques
- Analyze historical data: Review past usage and traffic trends to identify growth patterns and seasonality. This data helps establish a baseline for future resource needs and infrastructure scaling.
- Monitor current trends: Use real-time monitoring tools like Prometheus or Grafana to observe system performance and resource utilization. Identifying spikes or steady increases in usage ensures you're prepared for demand fluctuations.
- Consider business factors: Factor in external events like product launches or promotions that may drive demand. Collaboration with marketing and product teams can provide insights to align infrastructure with business objectives.
- Use statistical models: Leverage time series analysis tools like Prophet or ARIMA and machine learning platforms to generate forecasts based on historical data. These models offer more refined predictions, reducing the risk of under or over-provisioning resources.
Proactive Scaling Strategies:
| Strategy | Description |
|---|---|
| Auto-scaling | Configure systems to automatically adjust resources based on demand. |
| Load testing | Regularly test systems under various load conditions to identify bottlenecks. |
| Capacity buffers | Maintain extra capacity to handle unexpected spikes in demand. |
Tools for Effective Demand Forecasting:
- Time series analysis tools: Tools like Prophet and ARIMA help you model and predict future demand based on past data, identifying long-term trends and seasonal variations.
- Machine learning platforms: Platforms such as TensorFlow or AWS SageMaker can be used to create predictive models that factor in more complex variables, providing more accurate forecasting for system capacity needs.
- Monitoring and observability tools: Tools like Prometheus, Grafana, and Datadog are essential for real-time monitoring. They offer detailed usage data that can be analyzed to anticipate demand and optimize resource allocation.
By implementing robust capacity planning and demand forecasting, organizations can ensure their systems remain reliable and performant as they scale.
9. Cultivating a Culture of Shared Responsibility
A culture of shared responsibility is fundamental to successful SRE implementation. This principle emphasizes collaboration between development and operations teams to ensure system reliability.
Key Aspects of Shared Responsibility:
- Breaking down silos: Promote collaboration across teams with regular cross-functional meetings and shared tools like Slack or Jira. This ensures transparency and a holistic understanding of the system’s lifecycle.
- Shared on-call rotations: Include both developers and operations staff in incident response with automated scheduling tools like PagerDuty. This ensures diverse expertise is available for effective issue resolution.
- Cross-functional teams: Form teams with varied skills (developers, ops, etc.) to address reliability challenges. This promotes a balanced approach to both technical and operational issues.
- Collective ownership: Foster ownership of the entire system using GitOps for infrastructure-as-code and automated monitoring, making every team member invested in the system's long-term health.
Building a Culture of Reliability Across the Organization
- Emphasize reliability in company values: Make system reliability a key business metric and incorporate it into performance reviews and leadership goals.
- Recognize and reward reliability improvements: Reward teams for enhancing uptime and performance metrics, using tools like SLIs and SLOs to measure and incentivize success.
- Provide ongoing SRE training: Offer resources like certifications, books, and workshops to ensure all team members are well-versed in SRE principles and practices.
- Encourage transparency in reliability issues: Promote a blame-free culture with open post-mortems and shared learning tools like Confluence, ensuring continuous system improvement.
By cultivating a culture of shared responsibility, organizations can improve system reliability while fostering a more collaborative and efficient work environment.
10. Leveraging Observability for System Reliability
Observability is a crucial SRE principle that provides deep insights into system behavior, enabling teams to quickly identify and resolve issues.
Implementing Distributed Tracing
- Use Compatible Tracing Libraries: Choose tracing libraries like OpenTelemetry, Jaeger, or Zipkin that work with your tech stack. These tools standardize trace collection across services and languages (e.g., Python, Java, Go).
- Instrument Code to Capture Spans and Tags: Add spans around key operations like HTTP requests, DB queries, or API calls. Use tags to add context (e.g., user IDs, service names) to help track performance and identify issues.
- Implement a Tracing Backend: Set up a backend (Jaeger, Zipkin, AWS X-Ray) to collect and store trace data. Ensure its scalable to handle large volumes and integrates with monitoring tools for comprehensive analysis.
- Visualize Traces to Identify Bottlenecks: Use trace visualization tools to map request flows and spot performance bottlenecks. This helps pinpoint slow or failing services, improving troubleshooting and optimization.
Comprehensive System Observability: Best practices
| Best Practices | Techniques |
|---|---|
| Implement a robust observability stack | Use tools like SigNoz for end-to-end observability. |
| Standardize instrumentation | Ensure consistent data collection across all system components. |
| Implement context propagation | Maintain request context across service boundaries. |
| Use sampling techniques | For high-volume systems, implement intelligent sampling to manage data volume while maintaining visibility. |
Implementing Observability with SigNoz
SigNoz is an open-source observability platform that supports the implementation of SRE principles. Key features include:
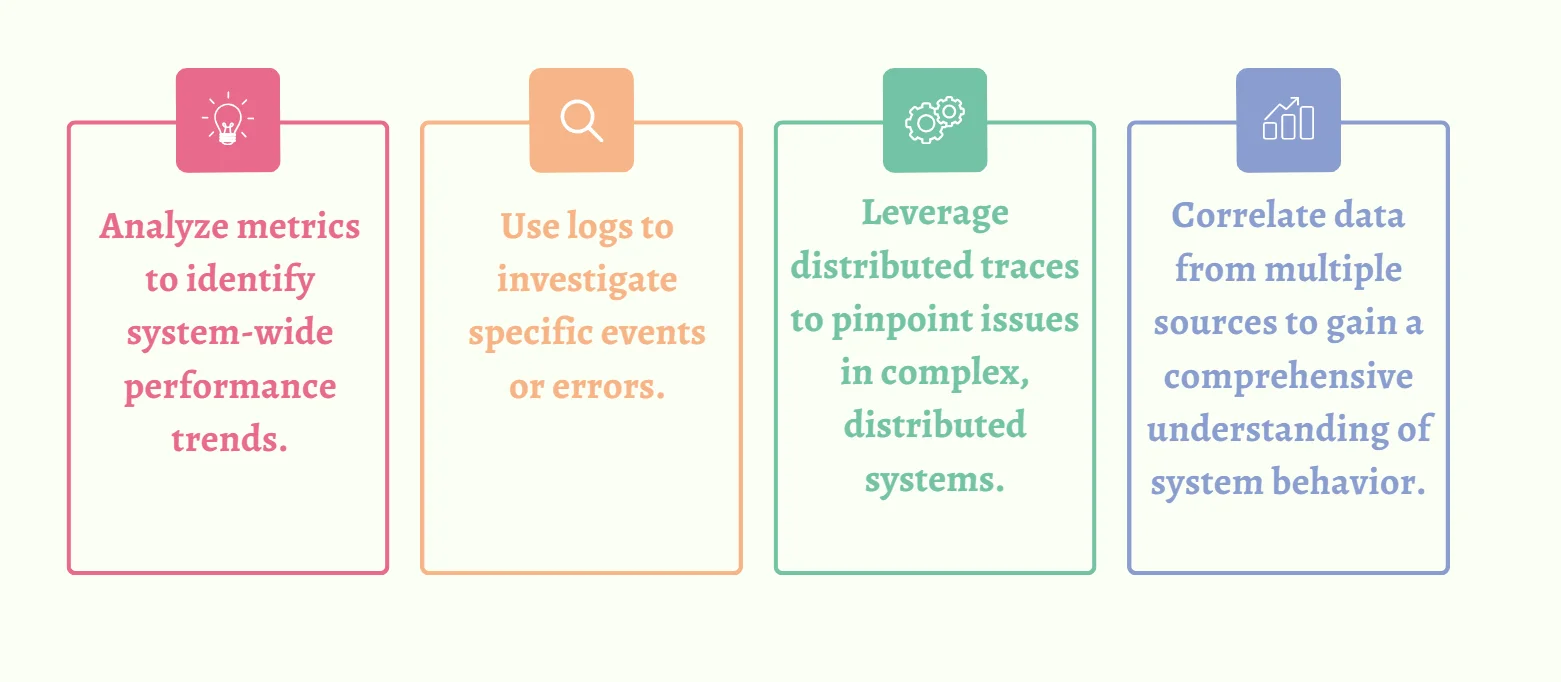
- Distributed Tracing: Trace requests across microservices to visualize request flows and pinpoint bottlenecks. This enables you to understand how different components interact, track latency, and identify performance issues across the entire system.
- Metrics Monitoring: Track critical performance metrics and set up alerts for anomalies or threshold breaches. By monitoring key indicators like response times, error rates, and resource usage, you can proactively detect issues before they impact end-users.
- Log Management: Aggregate logs from different services for centralized analysis and troubleshooting. This allows you to correlate logs with trace and metric data, providing a more holistic view of system behavior and making it easier to diagnose complex issues.
- Custom Dashboards: Design personalized dashboards to visualize system health and performance in real time. Custom dashboards enable teams to focus on the most relevant metrics and provide an intuitive way to monitor and analyze system status at a glance.
SigNoz cloud is the easiest way to run SigNoz. Sign up for a free account and get 30 days of unlimited access to all features.
You can also install and self-host SigNoz yourself since it is open-source. With 19,000+ GitHub stars, open-source SigNoz is loved by developers. Find the instructions to self-host SigNoz.
SigNoz supports the 10 essential SRE principles by providing comprehensive observability, enabling effective incident response, and facilitating continuous improvement of system reliability.
Key Takeaways
- SRE principles balance reliability with innovation and speed.
- Embracing risk, setting SLOs, and eliminating toil form the foundation of SRE.
- Automation, simplicity, and continuous improvement are crucial for reliable systems.
- Cultivating shared responsibility and leveraging observability are key to successful SRE implementation.
- Tools like SigNoz can significantly enhance your ability to implement SRE principles effectively.
FAQs
What is the main difference between SRE and traditional IT operations?
SRE applies software engineering principles to IT operations, focusing on automation, measurable outcomes, and proactive problem-solving. Traditional IT operations often rely more on manual processes and reactive problem-solving.
How do SRE principles contribute to better customer satisfaction?
SRE principles lead to more reliable systems, faster incident resolution, and improved performance — all of which directly enhance the user experience and increase customer satisfaction.
Can SRE principles be applied to small-scale operations or startups?
Yes, SRE principles can be scaled to fit organizations of any size. Even small teams can benefit from practices like setting SLOs, automating repetitive tasks, and implementing effective monitoring.
How does embracing failure lead to more reliable systems?
By treating failures as learning opportunities and conducting blameless postmortems, teams can identify and address systemic issues, leading to continuous improvement in system reliability.

